
It’s been a long hiatus for me posting content to this blog. Been a bit preoccupied with everyday life, but getting back into the swing of things with a detailed meteorological summary of the tragic and deadly extreme flash flooding event that took place on the evening of Sept 1, 2021. Credit for this goes in part to my friend and colleague Phil Lutzak, a fellow graduate of the PSU World Campus Weather Forecasting Certificate Program.
Synopsis
In this overview of the NYC flooding event of September 1st, 2021, the main goal is to ascertain why such severe flooding occurred in light of the preceding and concurrent weather conditions for that day. While it was quite well forecast by the NHC and NWS office forecasts in terms of a significant flood threat, clearly no national office could pinpoint the areas that would suffer the worst flooding until the day of the event when it was much clearer where the heaviest rains would be falling, nor could they possibly have gotten the exact severity correct given current forecasting capabilities. In hindsight we will examine the existing conditions during and just before the most intense period of the flooding and try to determine which developing synoptic and mesoscale parameters gave the most clues as to why much of the worst flooding conditions would be directly within the New York City metropolitan area.
Forecasts Leading Up to the Event
There was a misconception after the event that the meteorological community failed to forecast the possibility of this event occurring. In fact, National Weather Service Weather Prediction Center had a solid grasp of the risks associated with the post-tropical remnants of Ida, having issued a high risk for flash flooding for areas of the Mid-Atlantic and Southern New England in the early morning hours of Wednesday, 01 Sept 2021 (4:20 AM EDT).

The forecast discussion behind this excessive rainfall outlook was chilling in its prescience, specifically citing the possibility of deadly flash flooding and 3-8” rainfall totals.

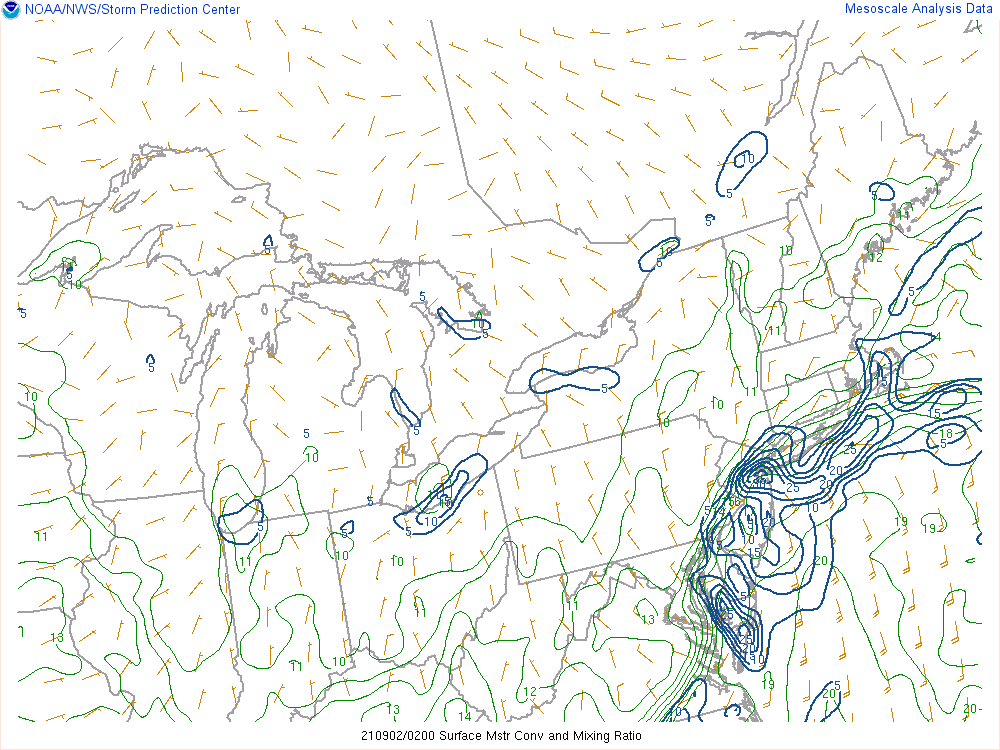
At 3:22 PM EDT, WPC issued Mesoscale Precipitation Discussion #0925, with the accompanying image:

In MPD #0925, WPC forecasters referenced 2-3+” per hour rainfall rates being possible due to a combination of factors, most notably very strong low-mid level forcing via frontogenetical influences and highly efficient, deep layer warm/tropical rain processes – a characteristic of Ida’s hybrid tropical/extratropical nature.
The importance of Ida’s unique blend of tropical transitioning to extratropical character is also underscored in MPD #0923, in which WPC forecasters discuss the presence of a developing south-southwesterly low-level jet. This feature would reach peak strengths of 35-55+ knots at the height of the event, and became a critical ingredient in creating the exceptionally efficient moisture transport into the NYC area, shown in the following sections.
By 9:28 PM that evening, the worst-case scenario envisaged by forecasters leading up to the event came to fruition and the NWS OKX office issued its first ever Flash Flood Emergency for NYC, containing the emphatic “THIS IS A PARTICULARLY DANGEROUS SITUATION” wording…

Meteorological History
Surface Conditions
The following chart shows the radar representation and surface charts of the 48-hour progress of tropical depression Ida from the lower Mississippi valley into the Tennessee and Ohio River valleys and then into the mid-Atlantic and northeast regions. In the middle image it is clear that the heaviest precipitation was reduced as its inflow was becoming detached from the very moist Gulf of Mexico. The third, rightmost image shows how the tropical low, now merging with the warm front, was elongating north to south but at the same time tapping into a very moist airflow from the Atlantic Ocean, strongly enhancing the area of heaviest precipitation near the center of lowest pressure.

Low and Mid-Level Conditions
While the high precipitation producing ability of tropical depression Ida was still in evidence, the position of its southerly flow in relation to the fairly stationary warm front allowed for maximum isentropic lift to focus right over NYC and surrounding areas, with much of the convection moving in from the south still having high precipitation producing energy powered by high theta-e tropical inflow.
Here’s the MUCAPE analysis from 0200 UTC showing 1,000-2,000 J/kg positioned over NYC,

… and the following showing the extremely high 850 mb level moisture transport over the NYC area at 0200 UTC.

The 925-850 mb frontogenesis chart shows clearly where maximum frontogenesis was occurring

and the surface moisture convergence and DMC charts show, not surprisingly, that a maximum for surface and deep moist convergence was occurring over NYC and surrounding areas.

Mid to Upper Levels
This situation was one of the clearest examples of how baroclinic forcing can convert a weak or decaying tropical cyclone into an extremely prolific rainmaker. The 500 and 300 mb conditions were critical in allowing this approaching tropical low to make a fairly quick transition to a strong extratropical low. The result was the previously discussed extremely high moisture convergence right over the city.
The 300 mb chart from 8PM EDT shows the right rear entrance region of a quite strong jet streak for late summer (100-120 knots) moving into position almost directly over the low which was just southeast of the NYC area, allowing for maximum divergence above the low center as it was merging with the warm/stationary front. This allowed for very high divergence to position over an equally strong low level convergence zone.

In addition, the 500 mb analysis shows an ideal placement of the area just east of the trough base over the lower-level low circulation to allow strong upper-level divergence, resulting in intensification of the transitioning surface low.

All levels
For one final view that ties activity at the previous levels together, here’s the ARL simulated skewT diagrams for 0100 and 0200 UTC at New York City that evening. Clearly the atmosphere was saturated throughout with very high theta-e values at the lowest levels.

Conclusion
From the NY Times, September 2nd, 2021:
The rain broke records set just 11 days before by Tropical Storm Henri, underscoring warnings from climate scientists of a new normal on a warmed planet: Hotter air holds more water and allows storms to gather strength more quickly and grow ever larger.
In New York City, the dead ranged in age from a 2-year-old boy to an 86-year-old woman, the police said. Some drowned in basement apartments in Queens, where a system of makeshift and mostly illegally converted living spaces has sprung up.
Below are two dramatic images of the flooding in NYC. On the left is severe subway flooding that occurred in lower Manhattan (courtesy NY times). At right are multiple stranded vehicles on the Major Deegan Expressway in the Bronx borough of NYC (courtesy Craig Ruttle/AP).

It’s likely not possible at this time, nor in the near future, to use RAP or any of other quickest analytical tools to anticipate imminent flooding at the smallest mesoscale any more than we are currently able to. At this stage of the science, the most skilled forecasters use the best modeling tools currently available along with their own invaluable experience in watching unfolding precipitation patterns on radar loops and, combined with mesoscale graphics such as we have displayed here, anticipate where the heaviest precip is moving and whether it will intensify, weaken or remain stable.
In light of this, a critical takeaway is to encourage better education of the public about what an “Emergency” and what a “Particularly Dangerous Situation” mean in practical terms. In other words, when the public receives an EAS alert with these terms in it, they need to be acutely aware of what preventive actions to take immediately rather than just dismiss this as another alert that probably won’t affect them. One other challenge with this system is that these alerts are often only translated to only one or two other languages. This is a problem for a city with hundreds of thousands of immigrants speaking myriad languages, many of whom are not literate in English, as this renders these vital, lifesaving alerts essentially useless to a wide range of the public, with predictably tragic consequences.